RideLondon 2015
Posted by Michael Okarimia in charity on August 3, 2015

On Sunday 2nd August I cycled 100 miles through London & the Surrey Hills as part of the Prudential RideLondon, and I’m raising money for the charity Leukaemia And Lymphoma Unit, based in UCL Hospital in Euston. (LALU)

This the second time I’ve done a fund raiser for any charity, the last one was for LALU five years ago!
My connection with LALU is that they have been helping my uncle battle Leukaemia for the past decade.This charity have been supporting his out-patient care whilst he is undergoing chemotherapy; they provide bursaries for the fantastic post-grad Leukaemia nurses who work there.
Here’s the link that will let you donate, all proceeds will go to the charity:
http://uk.virginmoneygiving.com/MichaelOkarimia-Ride100-2015
I finished the ride in 5 hours 50 minutes, well under my target of 7 hours 30 minutes! It was an amazing day and unforgettable experience to ride along closed roads, particularly those in central London. At the finish I relaxed with my friends and family in Green Park.
Here’s the official event timings I finished; in 5 hours and 50 minutes
Here’s my route with the all the juicy cycle statistics: https://connect.garmin.com/modern/activity/852419031
The weather conditions were perfect, sunny and with very little wind. I had to cycle from my flat in south east London to the beginning, and I took advantage of the fact that the Blackwall Tunnel was closed off to traffic and only RideLondon participants were allowed to use it. Free wheeling down there from Greenwich north bound in a empty tunnel was incredible; and I hadn’t even started the ride by that point!

RideLondon 2015 start point in the Olympic Park in Stratford
At the northern end of the Blackwall Tunnel I was confronted with the sight of hundreds of cyclists riding along the course towards central London. I mistakenly joined them and rode along for about half a mile before realising they weren’t heading to the start point in Stratford, so I turned around and eventually found my correct destination.

RideLondon 2015 start point
The start point was the Olympic Park in Stratford, and the route began with us riding down the A12 which was closed off to traffic. Zooming along three lane highways and through underpasses like the Limehouse Link and Hyde Park Corner underpass were such an adrenaline rush!

At Kingston the outbound and inbound routes ran along side each other on the same road; here I spotted some of the fast riders who had left a few hours ahead of me, rushing into central London.

Druid’s Head Pub, Kingston

The famous Surrey Hills were beautiful and rolling along it’s narrow, leafy country lanes packed with hundreds of cyclists called for careful attention to be paid. After a 20 minute stop atop Boxhill for some well deserved cake made by the villagers of Boxhill, I continued again.

The numbers of riders thinned out somewhat and I was able to pick up the pace, weaving though the slower riders on the largely downhill sections back to central London. Heading back through Kingston, I think I spotted some of the professionals heading back to the Surrey Hills for RideLondon Classic; famous riders such as Bradley Wiggins and Mark Cavendish were amongst their number.
Here I am crossing Putney Bridge, with only seven miles left till the finish!
The last 30 or so miles were along dual carriageways for large stretches which were closed in both directions; having six lanes to ride along was a very rare opportunity so I made the most of it by cycling on the wrong side of the A-Roads whenever I could and soaking in the views.


My friends caught some video footage of me on the final sprint finish along The Mall!
I didn’t notice them until I had already passed, and I didn’t want to stop at that point!
Of the 25,000 entrants, I was in the last few hundred participants to depart, with a departure time of 08:51. Some of my friends had left at around 06:30 so were in the earlier waves of riders. It turns out I had underestimated my average pace when I filled in the form to enter the sportive with rather unambitious eight and a half hours completion time. This spent most of ride over taking most of the cyclists around me, since the faster groups had left earlier. Unlike when one is running overtaking other participants requires quite a lot of care and there is a risk of a crash. Thankfully I avoided that and took my time.
Once past the finish line I took an obligatory selfie:

Over the finish in Buckingham Palace
I couldn’t have done it with out the help of my friends who I trained with, here we are at the top of Boxhill:

Training at Boxhill with my friends
My friends who also rode the course had finished a few hours before me; they stuck around as we had a picnic in Green Park:

My friends also completed the ride!
It was a fantastic experience and I certainly hope to be able to cycle in the RideLondon 2016 next year!

At the finish line in Green Park
Bonus video footage of the ride by my friend Dave on his GoPro:
Fixing 7digital’s Music Search, Part Two: The 88% Speed Improvement
Posted by Michael Okarimia in 7digital, API, Automation, CFEngine, DevOps, search, SOLR, Vagrant, Virtualization on August 18, 2014
I’m Michael Okarimia, and I’m Team Lead Developer of the Content Discovery Team at 7digital, starting from Jan 2014. The Content Discovery team recently improved the catalogue & search infrastructure for the 7digital API. This post is the second in a series which explains how we turned resolved many of the long standing problems with 7digital’s music search and catalogue platform. If you haven’t read the first post in the series, which explains the problem of making 27 million tracks searchable, go and start reading from there.
In this post I detail how we improved the track search service so it’s response times reduced by 88%.
How we fixed track search: From 2014 onwards
As discussed in the previous post in this series, the data store used for searching tracks was a Lucene index being used as a document store, totalling 660gb in size. It was clearly far too large, and a scalable alternative had to be found. We also had to solve the inconsistency problems what arose due to the search index never being as up to data as the SQL database used to power the rest of the platform. These problems manifested themselves to API users as sporadic internal server errors when ever they wanted to stream or purchase a track that was returned from a search result.
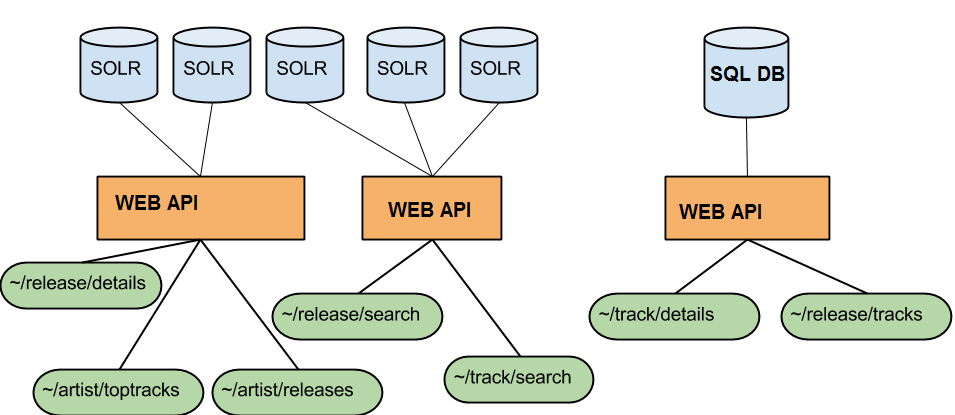
Search and Catalogue API endpoints with their different databases. This caused inconsistencies, but it increases availability
Rather than using Lucene as both a document store and a search index, we decided to create a new search index based on the searchable fields only, and use it to resolve 7digital track IDs. Armed with the track IDs that matched the search terms, we could do a look up on the catalogue database and then return that as the result. At the time we thought this should fix the inconsistency problem, and perhaps make searching faster.
Given that we were all relatively new to the team, we did some through investigation of the the search platform. We discovered that the previous schema in production was indexing fields like track price which were never actually searched upon. Additionally all of the twenty nine fields were stored, which was needed because it was used as document store. This increased the size of the index.
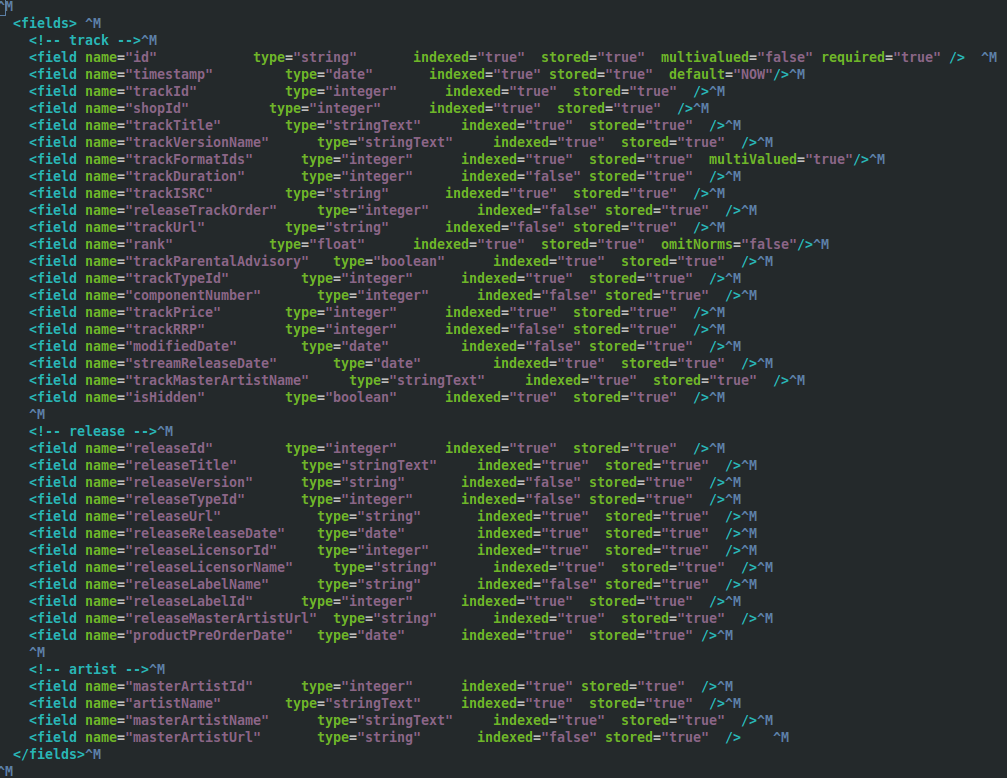
The index used to be set up as a document store, which made is slow to query
We created a prototype and came up with a much smaller search index, around 10 Gb in size compared with 660Gb. This new index contained only the searchable fields, such as track title, artist name and release title, reducing the schema down from twenty nine indexed fields to just nine.
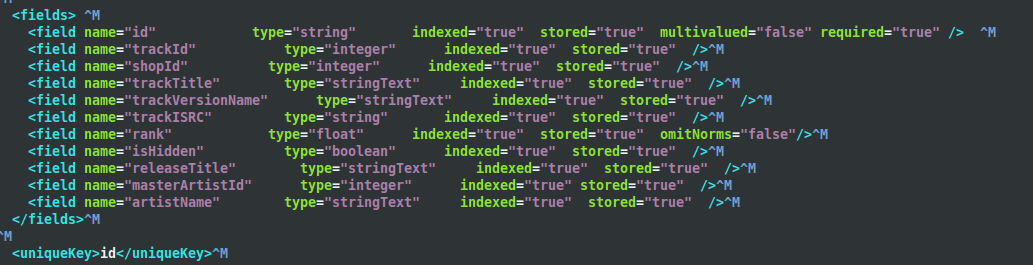
The new track schema, containing only searchable fields
When querying the new smaller index, the response would only contain the track IDs. However the response from the track search API endpoint is more than a list of track IDs. It is enriched with ample track metadata that can be used to build results in a search results page. There had to be a second step to fetch this data.
The returned IDs would then be used to look up the details of the track (such as it’s title, price and release date), and then the track details were composed into a single, ordered list of search results. The meant that the modified track/search endpoint would then return that list, which looked exactly like the old track/search responses that were returned from the giant index.
There was already an API endpoint that returned the contents of a track, namely, the ~/track/details endpoint. When given a 7digital track ID it returns all the available track meta data, such as track title, artist name, release date, etc. It’s response lacked some of the fields we require that were returned in the track search responses, so we added them so it now returns the price and available formats of a track.
We built this second index and deployed it to production in parallel with the gargantuan 660Gb one. One by one we rewrote the search & catalogue API endpoints so they instead used the smaller index to fetch matching track IDs and then called the ~/track/details endpoint to populate the results.
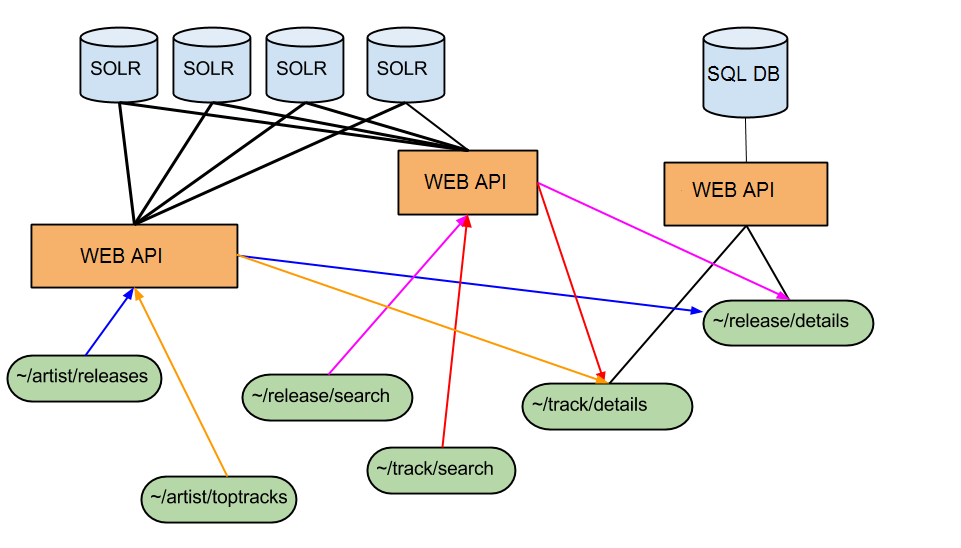
Catalogue and Search Endpoints as of July 2014. All responses are populated from the SQL DB which is most up to date. There are no longer inconsistencies
To test that the schema changes worked we learned that the best way was to use Vagrant and Test kitchen prior to pushing the schema to our continuous integration platform. We used CFEngine configuration management tool to define our SOLR schemas with the configuration file edited locally on a developer’s machine. Next we spun up a Vagrant instance that would apply the configuration defined in the file, and would then run Server Spec tests to verify some of the basic functionality of the SOLR server, using the altered schema. This arrangement was informed by our prior work to test infrastructure code, which I previously blogged about. Once the initial schema changes were known work on SOLR, we pushed the new schema up onto our continuous integration platform, something which Chris O’Dell has blogged about more eloquently than I could. Part our deployment pipeline then ran acceptance tests against the API endpoints which use this index, verifying that existing functionality was intact.
Using this technique, we migrated our APIs that relied upon this gargantuan 660Gb index to use the new smaller one instead. At the time of writing it is 100 times smaller, weighing in at 6.3 Gb.
The new smaller search index came with a number of advantages;
- being reliant on the ~/track/details endpoint meant we always returned current results, and we were 100% consistent with the rest of the API, which eliminated the catalogue inconsistencies problem;
- we could create a brand new index within an hour, meaning up to date data;
- much faster average response times for ~/track/search, reduced the response time by 88% from around 2600ms to around 350ms;
- no more deleted documents bloating the index, thus reducing the search space;
- longer document cache and filter cache durations, which would only be purge at the next full index every 12 hours, this helped performance;
- quicker to reflect catalogue updates, as the track details were served from the SQL database which could be updated very rapidly.
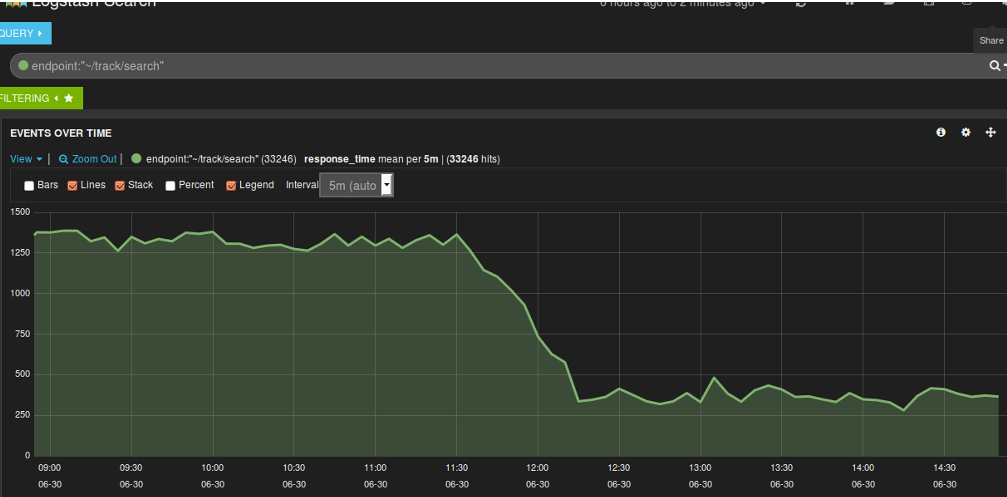
Y Axis units in milliseconds. Once we used a smaller index and enabled filter caching, the response time dropped.
Now that the entire index could fit in the memory of the server hosting it, this gave advantages such as:
- faster document retrieval;
- no more long JVM running garbage collection processes causing performance issues and server connection time outs. These were triggered replication when the index was changed, this now only occurred twice a day when the index was rebuilt;
- The platform could now cope with more traffic, based our our load tests using JMeter
Searching for Music Releases
We have also started this strategy for our release search endpoint. This endpoint performs searches for on the metadata of a music release based on the search terms. For example, one can search for either an artist or a release title. This endpoint queries a Lucene index containing data about music releases which is used as a massive document store as well as a search index. There are around 2.7 million releases in 7digital’s catalogue that are searchable.
We have integrated a call to the ~/release/details endpoint for each release ID returned in the results of a query to the ~/release/search index. This makes the endpoint always consistent with the catalogue DB, which fixed the inconsistency problem we had when searching for releases. At the time of writing we haven’t yet built a smaller release index which would improve response time, but this work is already under way.
We aim to reduce the size of the release index too and be able to build a new one multiple times a day.
For our track index, creating a new index of the music catalogue on a regular basis meant we could take advantage of the index time features that SOLR offers. I’ll write about how we used those features in a future post.
What we learnt
Never* Avoid, if possible incrementally add or delete documents to or from a Lucene index without rebuilding it regularly. Otherwise you will have an index filled with unsearchable but deleted documents which will bloat the index. This means you will inexorably experience search query times slowing over time;Never* Avoid using Lucene as a document database, it won’t scale to work effectively with millions of richly annotated documents;- Make sure your index can fit in the memory of the server it’s hosted on;
- Index as few Lucene fields as possible;
- Store as few Lucene fields as possible;
- Replication will invalidate your SOLR caches, and will trigger long running JVM garbage collections, try to minimise how often it happens;
- If you are using a Master/Slave SOLR configuration, slaves with differing replication polling intervals will lead to inconsistent responses when you eventually query the oldest non-replicated slave;
- Storing your index on Solid State Drives will speed up query time;
- Regularly rebuild your index to keep it small;
If you’re in interested in some more context of how we decided upon the implementation, my colleague Dan Watts has an excellent write up on his blog, detailing some of the problems that I mention in this post.
*Updated my opinion on how to Lucene upon reflection of Nick Tune’s comments.
Fixing 7digital’s Music Search, Part one: The Gargantuan Index
I’m Michael Okarimia, and since January 2014 I’ve been in role of Lead Developer of the Content Discovery Team at 7digital. The Content Discovery team recently improved the catalogue search infrastructure for the 7digital API. This is the first of a series of posts which describes how we made 7digital’s music search usable for our users and clients.
This is a three part series of posts which describes the work we’ve done on 7digital’s search platform.
This post describes the issues 7digital had with their platform and the second post describes how we improved response times for the problem, and then the third and final post covers how we improved the relevancy of the search results
The Problem with Music Search; The state of play in Jan 2014
Searching for a music track in 7digital’s API is often the first point of contact for accessing its catalogue of 27 million tracks. The API that 7digital provide has many publicly accessible web services which are reached via a specific URL, which we refer to as API endpoints. To stream or purchase a track, one first needs to know what it’s 7digital track ID is. 7digital track IDs mean nothing to the average end user, so searching for a track based on its track title and/or artist name is a very common method of retrieving a 7digital track ID. The client consuming the API can then use this 7digital track ID to access a the music streaming service on the streaming API endpoints.
The title, artist, price and release date of a track is referred to as track meta data, which is data pertaining to the track, but not in itself the audio file of the track.
The Track search endpoint, as it’s name suggests, accepts search terms as text, and returns in the it’s search results the metadata of any matching tracks.
This is a track/search response from the 7digital API: http://api.7digital.com/1.2/track/search?q=Happy%20pharrell&oauth_consumer_key=YOUR_KEY_HERE&country=GB&pagesize=2
It was powered by web servers which sent its search requests a SOLR web application. SOLR provides http access to a Lucene search index, which is a very widely used piece of text search software. Some examples where Lucene is used are for searching for words that exist in a collection or books in a library. Many people will be familiar with a search engine on Twitter or Wikipedia, which uses Lucene to search for specific pieces of text in a massive corpus of text.
The two biggest problems were:
- In January 2014 the average ~/track/search response time was 4000 milliseconds
- Search results often were wrong, out of date, or would return errors.
In addition to being slow, search results would often contain releases that were no longer available or had been updated. This occurrence was manifested itself as poor user experience for users on 7digital.com site, who would be greeted by this message:
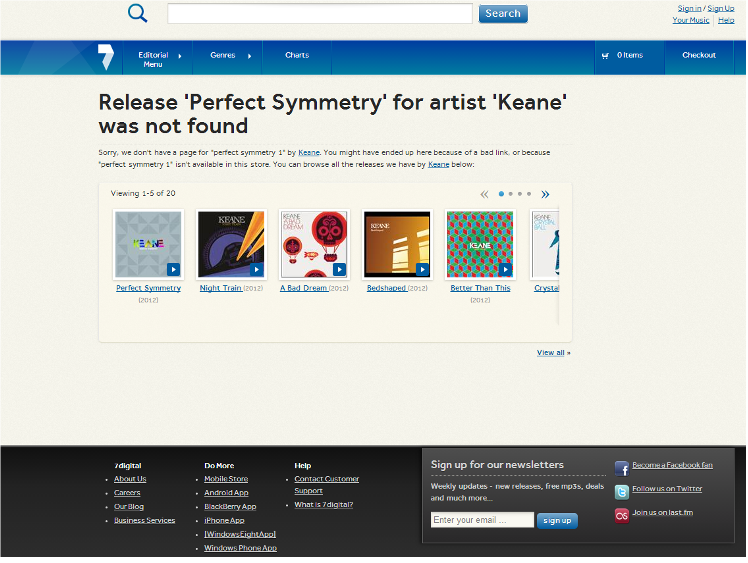
This used to be a frequent experience for users, caused by inconsistencies between the search data store and the catalogue data store
This was due to the platform having a separate search database and a catalogue database, which contained different results for the same content. The search database was updated in a different manner to the catalogue database and they were not always consistent with one another. More on that later.
Why was search so slow?
The meta data of the tracks was stored in a search index that was 660Gb in size, which is extremely large compared with many search indexes. Various tweaks to JVM and memory settings were made but they did not make a permanent improvement for very long.
660 Gb is very large for an Lucene search index. Why was it so big?
The Index size was 660Gb, containing 660,000,000 documents. Each document represented all the meta data for a single track.
It’s slow, so why not improve the hardware it was running?
A copy of the SOLR Index was replicated onto four physical servers, 24 cores each, 128 Gb RAM with 1.9TB storage on SSD discs. The server hardware the SOLR servers ran on were upgraded, initially from smaller virtual machines to larger ones, and then later on physical hardware. This was not cost effective given the response time performance we had!
If 7digital ‘s catalogue contains 27 million tracks, and one document represents a single track, then why were there 660 million documents in the search index?
According to the 7digital API documentation, here’s what a track/search response from the 7digital API looks like: http://api.7digital.com/1.2/track/search?q=Happy%20pharrell&oauth_consumer_key=YOUR_KEY_HERE&country=GB&pagesize=2
In the response there are 29 fields representing a track. Every one of the fields in the API response was stored in the Lucene search index. However a search will only match search terms against fields such as track title or artist name, rather than bit rate or image url.
The structure of the track index was such that the data was denormalised. A track could be available in any of the 44 territories 7digital operate in. There would be one track document for each track, multiplied by the number of territories the track was available in. In order to make a single track searchable in all territories there would be 44 documents added to the index. Almost all the field values in those a track documents for a given track would be identical, apart from fields specific to a territory like the price, currency and release date.
The reason for the huge search index size was that it was being used as a document store as well as search index. It worked accurately as a document store, but poorly as a search index for reasons of performance.
Unlike some other nosql use cases, there were almost always more tracks being added and an hourly basis. and very few being removed; every day sees more music released worldwide.
How were these 27 million tracks turned into a searchable index?
Updates to the index were incremental, minute by minute changes to the catalogue were sent via http to the master SOLR server which turned the data into a single index. This master server did not serve any search queries. That work was down by four other SOLR servers which periodically copied the index from the master SOLR server. These four servers are known as Slaves.
Replication from the master SOLR server to the slaves would take around 30-60 minutes, depending on the volume of changes.
Due to the incremental updates to the Lucene index, the number of track documents increased on hourly basis. Within the Lucene index the maxDocument count exceeded the number of searchable documents by a large margin. In Lucene, maxDocument count is simply the number of documents in the index, but this includes deleted ones too, which will not be returned in a search result. 30% of the 660Gb index contained deleted, non-searchable documents. The deleted documents used disc space and hurt search performance.
On a previous occasion in 2013 running a Lucene optimize command on this Lucene index took over 24 hours and prevented any new tracks to be searchable. Doing this regularly was not possible if the organisation needed updates on an minute by minute basis.
The deleted documents remained in the search index, gradually over time the index was getting bigger. In six months it increased by 160Gb.
So what was the problem with updating the index with new tracks as they were imported into 7digital’s platform, incrementally?
The pain points of a 660 Gb index, updated incrementally were:
- Data consistency! The delay between a track changes made on the source SQL database and the time it took to propagate into the SOLR slave servers would be at least two hours. There were many times when the change would be effected in the SOLR index, meaning resulting in poor user experience.
- It was slow to update larger volumes of changes. However, if there were less than a few hundred new tracks to add then updates were fairly speedy (within a few minutes);
- The index could not fit in memory of it’s servers as it exceeded 128Gb RAM available, which resulted it being read from the hard disc which is an order of magnitude slower;
- Since there was a unpredictable number of new tracks being added to the master index, a new version of the index was hourly replicated to the slave servers. Each time happened it caused any SOLR caching to be invalidated;
- Each cache invalidation triggered a Java JVM garbage collection process which was resource intensive and chewed up memory and CPU, resulting in slow response times and SOLR server connection time outs. Many searches would simply fail and return a 503 HTTP error response;
- Occasionally the index contained erroneous data which would have to manually updated by using a curl command, which was risky;
- Serving traffic from such a large index required a lot of hardware hungry;
- It was expensive to host this index in an virtualized environments, for example just one of the slave servers was similar in specification to an i2.8xlarge AWS instance
Why not create the entire index all at once, rather than sending constant updates? Wouldn’t that reduce the index size and help performance?
Yes it would. This was attempted in 2013 by it took around five days to complete, during which this time no new tracks could be added to the search engine. The alternative is was to acquire another large server with a Terrabyte of storage space and index the track data to there, but this still took five days. At the end of that process you would have an index with no deleted documents, yet it would be nearly a week out of date. This was clearly not acceptable for a fast moving multinational music market.
Now I know why search was so slow. Why were the search results often wrong?
The data returned from the search result was retrieved entirely from an single document in the Lucene index. Almost all of the other non search catalogue API endpoints were querying a different SQL database, which was the original data source for metadata. Given the time it took for the data to be read from the original SQL database, posted into the SOLR master server and then replicated to the slave servers, there would often be a gap in time before the two databases were consistent with each other. Occasionally a update would not make it to the SOLR slaves, and there search API would return stale results which would have to be manually updated.
Sounds like a nightmare. How did you solve these problems?
It was! Now we’ve adequately described the problem, my next post will explain how we both fixed the data consistency problem and also improved search response times by 88%